Invoicing & payments
Where the money numbers come from, and where the unbilled work shows up.
Reporting & dashboards
Did we make money on that account? Which crews are full next week? What have we done and not billed? The answers are already in your records; reporting is how you get them out. Built-in reports on every plan, the report builder on Pro, chart dashboards on Scale.
The problem
Most contractors run the season on a feel and settle up with the bookkeeper afterwards. By the time the numbers arrive, the accounts that lost money have already been renewed at the same price, and the crew that was underwater all summer has been underwater all summer.
Three levels
Built in
Season summary with CSV export, program round dashboard, capacity routes, renewal outcomes, unbilled visits and unbilled jobs. On every plan.
Built by you
Pick a module, choose columns, add filters and sorting, run it. Save the layout under a name, clone it, or update the definition straight from the grid. Pro and Scale.
Charted
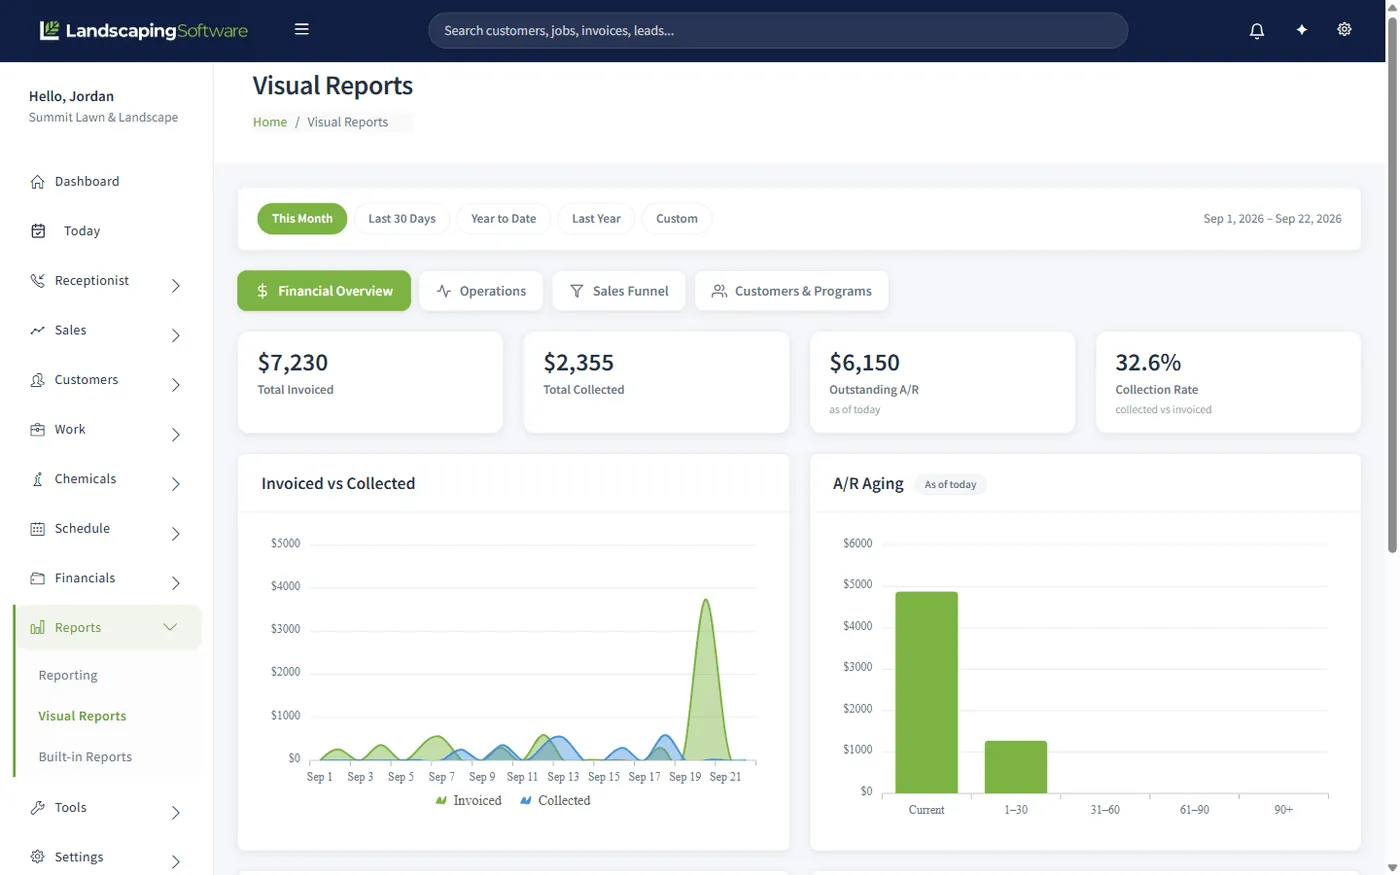
Financial Overview, Operations, Sales Funnel and Customers & Programs, over This Month, Last 30 Days, Year to Date, Last Year or a custom range. Scale.
Start from something
A report builder is only useful if somebody uses it, and a blank one rarely gets used. So the product ships with reports that answer the questions contractors actually ask, ready to run or to clone and adjust.
Saved layouts survive logging out, so the filters and column widths you set once stay set.
Works together
Where the money numbers come from, and where the unbilled work shows up.
Round dashboards and season summaries for the work that repeats.
Capacity routes: what the crews can actually absorb next week.
See how the whole platform fits together, from first estimate to renewal.
Questions
Four tabs over a date range you choose: Financial Overview (total invoiced, total collected, outstanding A/R, collection rate, invoiced versus collected over time, and A/R aging), Operations, Sales Funnel, and Customers & Programs. Every number is computed from your own records, not entered by hand.
Yes. Pick a module, choose the columns you want, add filters and a sort order, and run it. Save the layout and it is there next time, including your column widths and filters. Clone an existing report when you want a variation rather than a rewrite.
No. Seven ready-made reports ship with the product, including Active Jobs & Visits, Billing Readiness, Lead Pipeline Snapshot, Schedule Capacity Board and Weekly KPI Pulse. Run one as it is, or clone it and change it.
Those are built in: season summary with revenue and visit counts (exportable to CSV), the program round dashboard, capacity routes showing crew capacity against scheduled visits, renewal outcomes, and the unbilled visits and unbilled jobs reports.
Yes. Saved views persist, so the filters and column widths you set on a Monday are still there on Friday, and on the next machine you log into.
Built-in reports and the dashboard are in every plan. Custom reports are on Pro and Scale. The visual report dashboards are on Scale.
14-day free trial · No credit card required